Certify the comparability of biosimilars to their reference products
Biosimilar development is generating growing interest in the pharmaceutical sector as many biological drug patents fall into the public domain. However, biosimilars are very complex to characterize and highly sensitive to minor changes in manufacturing conditions, requiring additional methods to compare their critical quality attributes, safety and efficacy with the reference product.
We combined our expertise in fourier-transform infrared (FTIR) spectroscopy with statistical tools to develop a rapid and reliable method to compare secondary structure and glycan composition of batches of biosimilar candidates with their respective references (originators).
Our analyses allow to assess four types of critical quality attributes simultaneously in one single measurement: (I) the higher-order structure, (II) the glycosylation, (III) the total protein concentration and (IV) the quantity of other excipients (Tween, lipids,…).
We have already achieved multiple projects for companies developing biosimilars. The first critical quality attribute analysed is generally the secondary structure.
For instance, secondary structure prediction can be performed with an absolute error of 5.7% for α-helix and 6.7% for β-sheet. Based on multivariate statistics, batch-to-batch comparison allow to detect structural changes as minor as 0.1% of α-helix or β-sheet content.
The first graph shows a comparison of 3 batches of a biosimilar candidate with 3 batches of the originator in terms of secondary structure. At least 5 FTIR spectra were recorded for each batch. No significant spectral difference is observed between the biosimilar batches and the originator batches. The high-order structure profiles and especially the secondary structure of the biosimilar candidate and the originator are thus identical.
Using other spectral regions, additional critical quality attributes can be assessed. In the second example concerning another biosimilar candidate, the spectral region associated with the glycosylation is analysed. In that case, three batches of the biosimilar and the originator do not cluster together revealing significant difference in the glycosylation pattern.
In conclusion, FTIR spectroscopy is thus a powerful tool for multiparametric comparative studies between biosimilar candidates and their reference products.
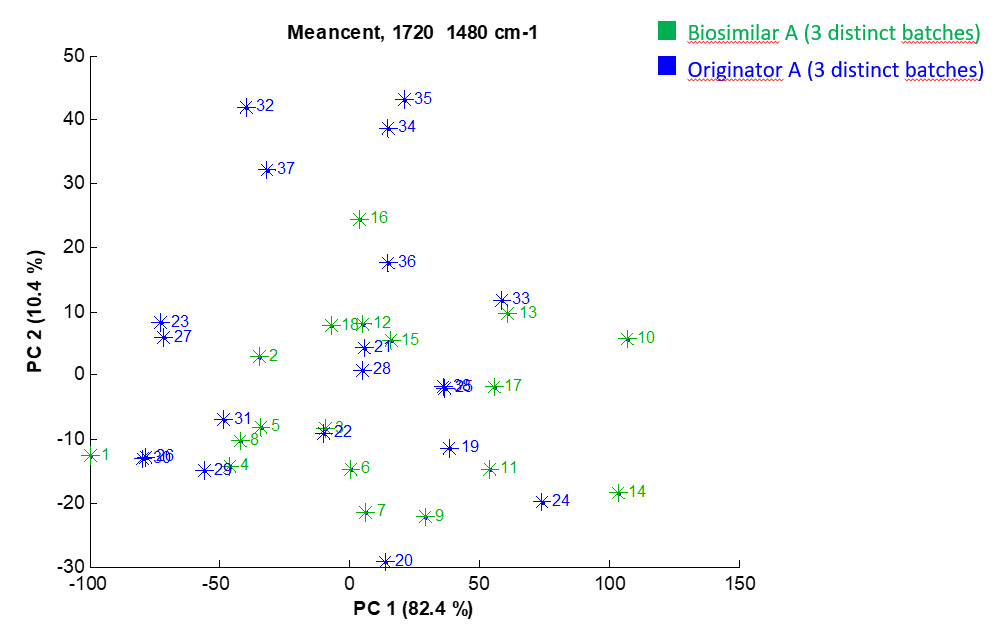
Example 1: PCA score plot depicting the projection of the 38 individual preprocessed FTIR spectra in the PC1-PC2 space performed on the 1720-1480 cm-1 spectral region. Each star stands for one spectrum. For the sake of clarity, a colour is associated with each group but the analysis is completely unsupervised. Percentages on the axis labels indicate the variance described by PC1 (82.4%) and PC2 (10.4%).
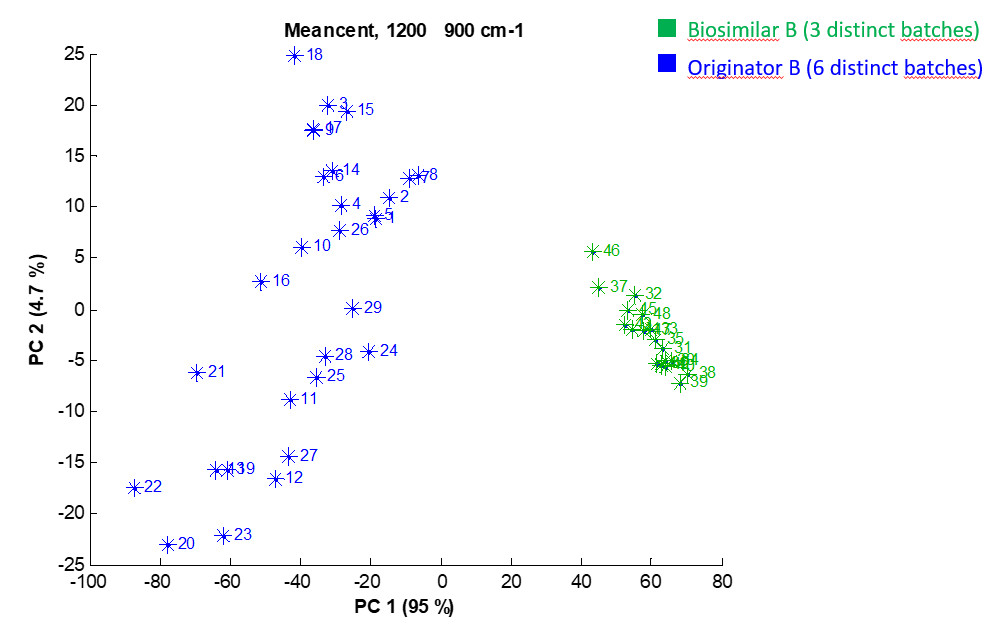
Example 2: PCA score plot depicting the projection of the 48 individual preprocessed FTIR spectra in the PC1-PC2 space performed on the 1200-900 cm-1 spectral region. Each star stands for one spectrum. For the sake of clarity, a colour is associated with each group but the analysis is completely unsupervised. Percentages on the axis labels indicate the variance described by PC1 (95%) and PC2 (4.7%).