Comparative assessment of the global glycosylation level
Glycosylation is the most common post-translational modification (PTM) in proteins, especially in biopharmaceuticals. It is a critical quality attribute with a wide range of impacts on factors, including such as product stability, bioactivity and safety. However, current glycan analysis methods involve multiple and lengthy sample preparation steps which can affect the robustness of the analyses. Therefore, the development of an orthogonal, direct and simple method is necessary.
Using fourier-transform infrared (FTIR) spectroscopy, we demonstrated that the intensity of a specific region of the spectrum clearly increases with global glycosylation level.
In this study, we used FTIR spectroscopy to compare 6 proteins in terms of the global glycosylation level. The global glycosylation level is defined as the weight ratio between sugars and proteins. The figure below shows the spectra (after preprocessing steps) of the six proteins. The glycosylation levels are indicated in the legend and have been determined using MALDI-TOF.
For the study of glycans in glycoproteins, the region between 1200 and 900 cm-1 is particularly interesting as proteins have very low signal in this region. We can notice on the figure below that the intensity of this spectral band clearly increases according to the global glycosylation level.
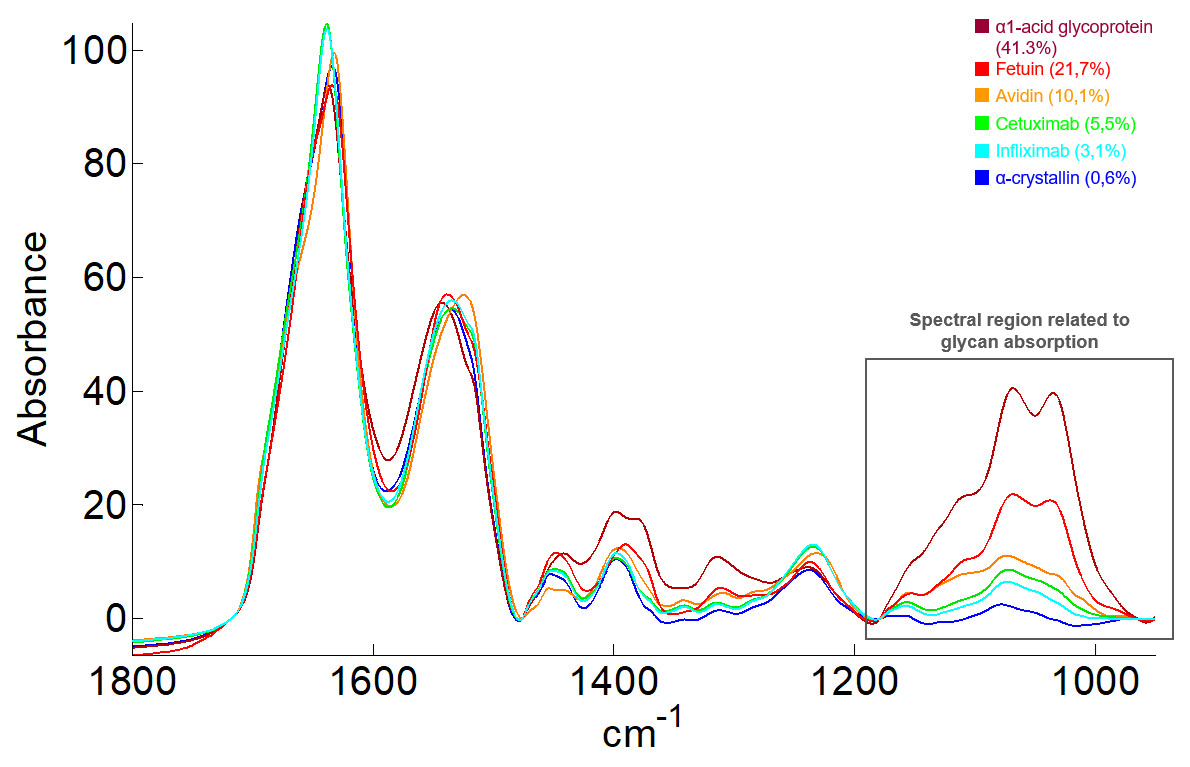
Comparison of the mean spectra (average of 6 spectra per protein and after the preprocessing steps) recorded for each glycoprotein. Each color corresponds to one specific protein. The glycosylation levels indicated in the legend and have been determined using MALDI-TOF.
The band between 1179 and 965 cm-1 have then been integrated to obtain an index related to the global level of glycosylation. A graph comparing the peak area for the six proteins is shown below.
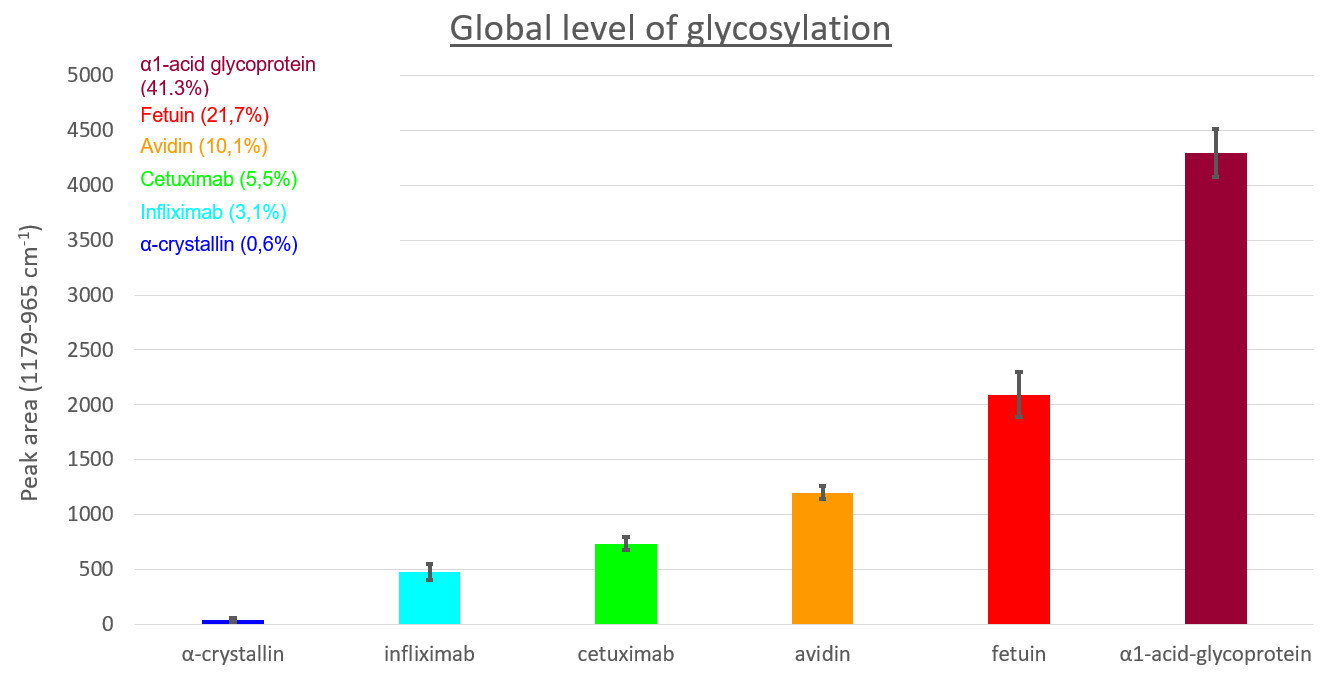
Comparison of the area of the spectral band corresponding to glycosylation for each protein. The area has been calculated by integrating the spectra between 1179 and 965 cm-1. Vertical error bars correspond to the standard deviation obtained from the six FTIR spectra recorded for each sample.
The peak area is clearly related to the global glycosylation level indicated in the legend, which has been determined by MALDI-TOF MS
References
Khajehpour, M.; Dashnau, J.L.; Vanderkooi, J.M. Infrared spectroscopy used to evaluate glycosylation of proteins. Anal. Biochem. 2006, 348, 40–8.
Derenne, A.; Derfoufi, K.-M.; Cowper, B.; Delporte, C.; Butre, C.; Goormaghtigh, E. Analysis of glycoproteins by ATR-FTIR spectroscopy – comparative assessment. Methods in Molecular Biology, 2020, in press.