Comparative assessment of glycan composition in monoclonal antibodies
Glycosylation is the most common post-translational modification (PTM) in proteins, especially in biopharmaceuticals. It is a critical quality attribute with a wide range of impacts on factors, including such as product stability, bioactivity and safety. However, current glycan analysis methods involve multiple and lengthy sample preparation steps which can affect the robustness of the analyses. Therefore, the development of an orthogonal, direct and simple method is
necessary.
We demonstrated that fourier-transform infrared (FTIR) spectroscopy is capable of distinguishing two monoclonal antibodies with highly similar glycan composition.
In this study, we used FTIR spectroscopy to compare eight batches (originators and biosimilars) of two monoclonal antibodies (rituximab and infliximab) in terms of glycan composition. These samples have similar but not identical glycan composition.
At least twelve spectra of each batch is recorded. The figure below shows the raw data (before the processing steps) and the glycan composition is measured using a gold-standard method.
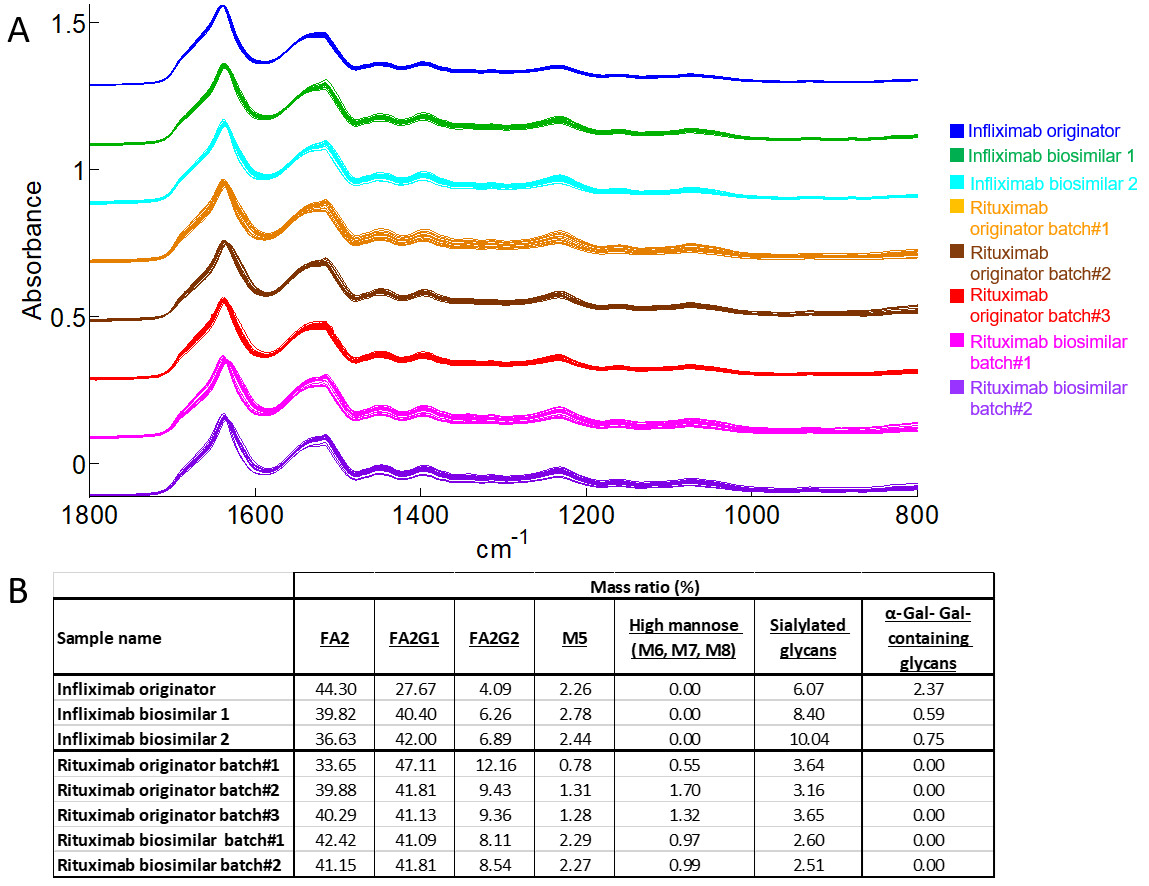
After the preprocessing step, we can enlarge the spectral region associated with glycosylation (1179 and 965 cm-1) as illustrated in the figure below.
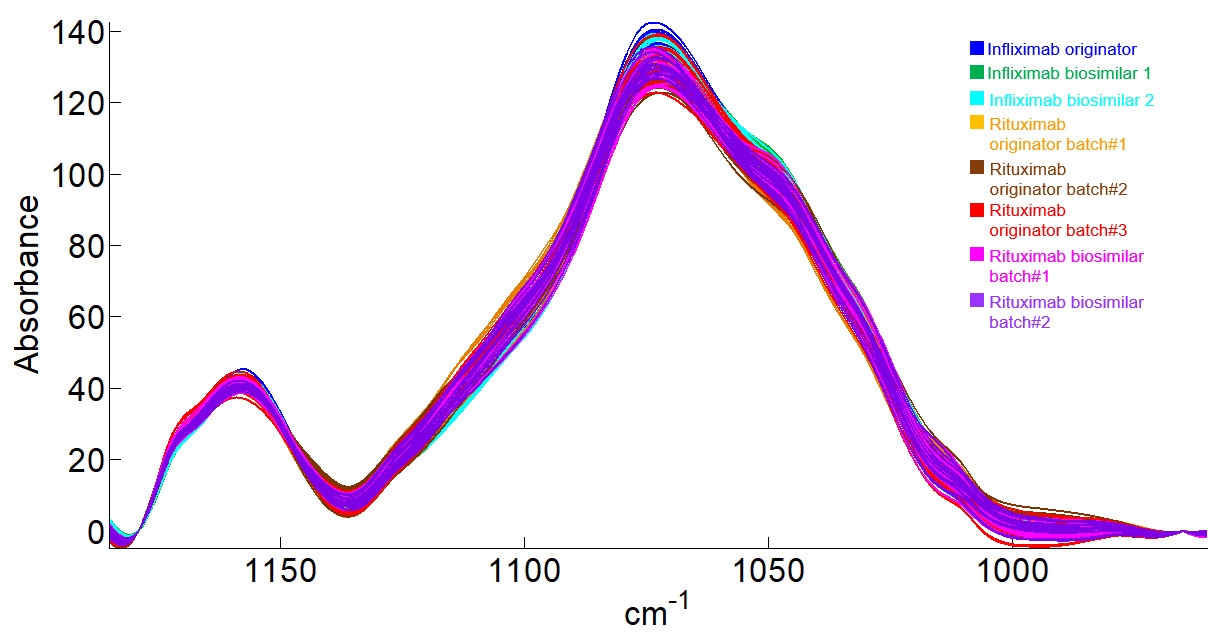
The shape of the spectra are very similar and multivariate and statistical tools are required to highlight differences among antibody glycosylation in this set of data.
Principal component analysis (PCA) is a powerful tool for high-dimension data to identify patterns and to express the data in such a way as to highlight their similarities and differences. This tool reduces the number of variables without much loss of information, taking into account most of the variance. It is an unsupervised analysis: the classification obtained does not suppose any a priori condition on grouping obtained. Whether a group is significantly different from the others was tested by multivariate analysis of variance (MANOVA) where each spectrum is identified by its projection on the first 4 principal components
The result of this analysis is a score plot which is presented in the figure below. In this plot, every point (star) in this plot is the projection of one spectrum in the space defined by the first two principal components (PC). The different samples are identified by a unique colour indicated in the right caption.
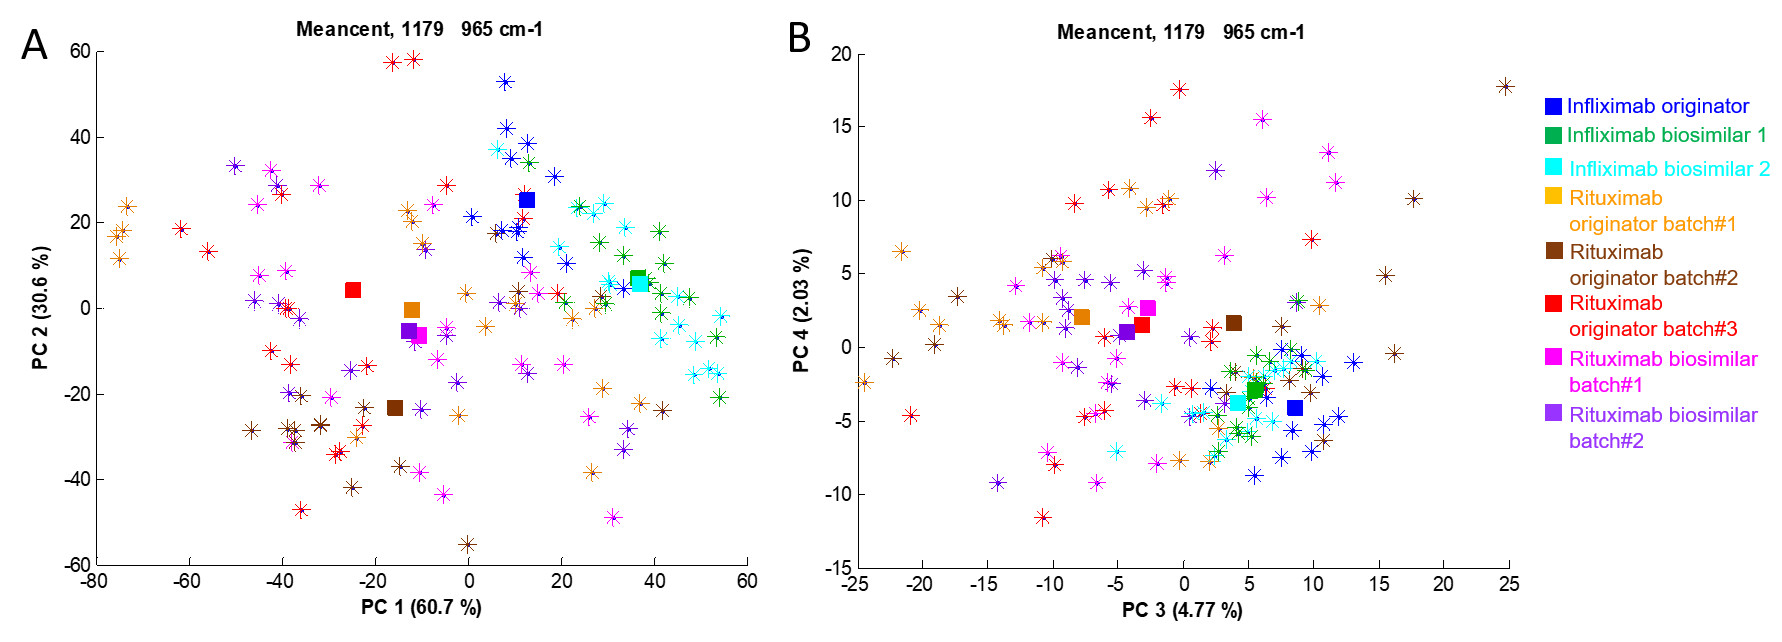
Even if the separation is not perfectly clear, all the spectra of rituximab (originator and biosimilar) are on one side of each plot and all infliximab batches (originator and biosimilar) are on the other side of the plot. While the representation provided in the previous figure reveals significant degrees of separation between the antibodies along the first 4 PCs, considering them all together requires use of MANOVA (see Table below).
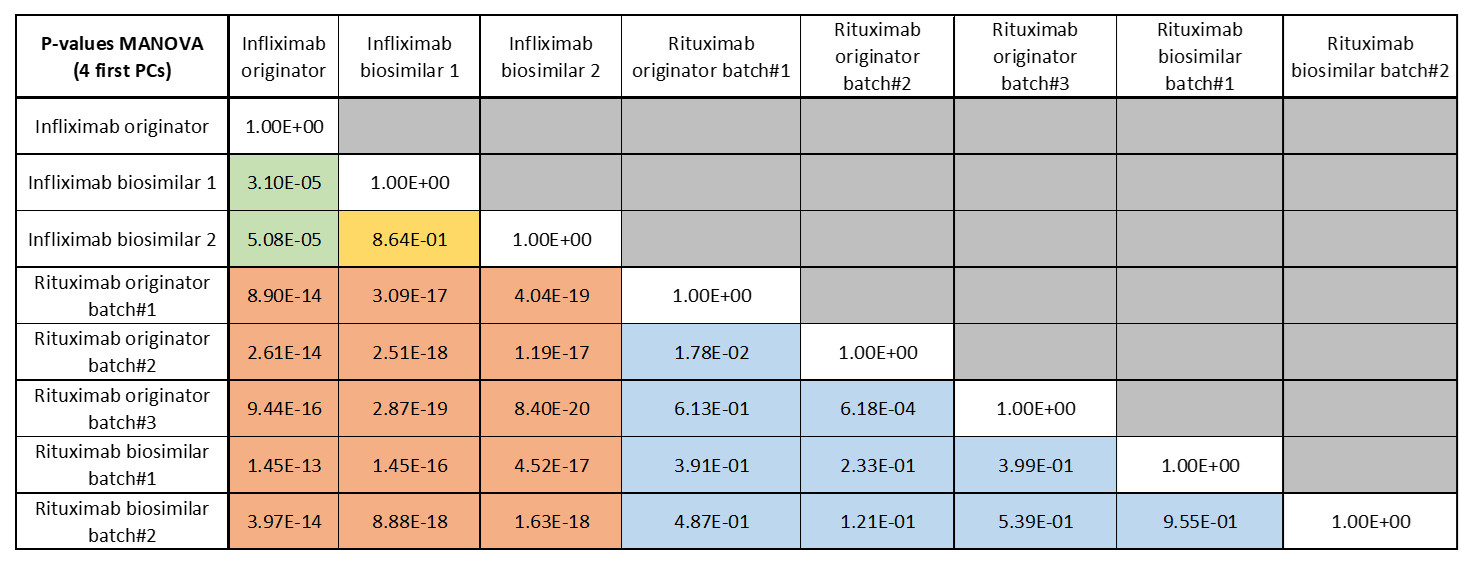
When comparing the two mAbs (rituximab and infliximab), the differences are particularly clear and all the p-values are lower than 0.001 (cf. orange cells in the table). In contrast, when comparing rituximab batches, p-values are generally higher than 0.001 (cf. blue cells in the table). Finally, when comparing the infliximab biosimilar with the originator, the p-values are lower than 0.001 (cf. green cells). It is however not the case when the two infliximab biosimilars are compared (yellow cell).
References
Khajehpour, M.; Dashnau, J.L.; Vanderkooi, J.M. Infrared spectroscopy used to evaluate glycosylation of proteins. Anal. Biochem. 2006, 348, 40–8.
Derenne, A.; Derfoufi, K.-M.; Cowper, B.; Delporte, C.; Butre, C.; Goormaghtigh, E. Analysis of glycoproteins by ATR-FTIR spectroscopy – comparative assessment. Methods in Molecular Biology, 2020, in press.
Derenne, A.; Derfoufi, K.-M. ; Cowper, B.; Delporte, C.; Goormaghtigh, E. FTIR spectroscopy as an analytical tool to compare glycosylation in therapeutic monoclonal antibodies., Anal. Chim. Acta. 1112 (2020) 62–71.